Three Inflation Indices and a Festival of Indicators: The New “Reality” Constructed Through Numbers Between TÜİK, ENAG, and İTO
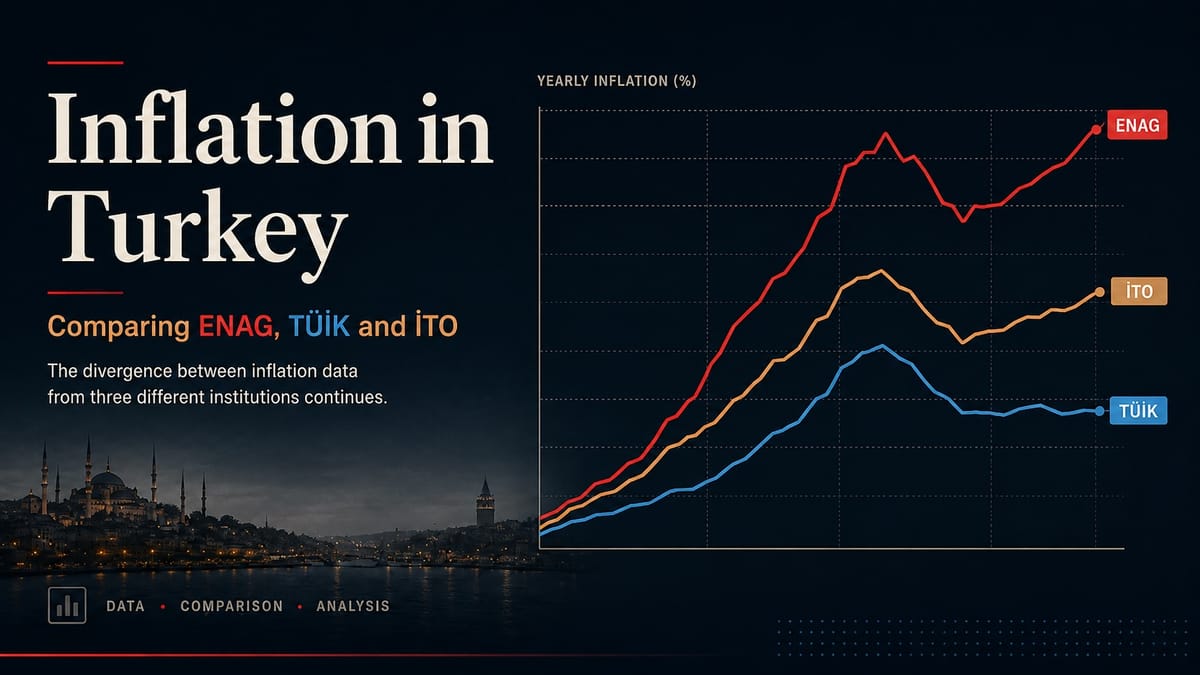
Turkey’s inflation debate is no longer only about prices. This piece follows the divergence between TÜİK, ENAG, and İTO, and asks what happens when inflation becomes not only an economic problem, but also a struggle over truth, measurement, and public knowledge.
Turkey Inflation Dashboard
A Comparative Timeline of TURKSTAT, ENAG, and ITO monthly consumer prices inflation indicators
Dashboard loading...
The long road to May 2023 had, in fact, begun with the March 2019 elections. Around that time, I had only recently started using Twitter. I began writing rather alarmist posts about inflation data and the economy coming off the rails after 2019.
What the opposition failed to understand, or perhaps simply did not care about, was the impact of the economic collapse before the 2019 municipal elections. As March 2019 approached, state-subsidized produce stalls were opened for the first time in many years. The government was trying to control prices by importing potatoes and onions.
Under normal circumstances, new political actors such as Ali Babacan should have built their public identity around the economy. His entire political career, and in many ways his future, should have depended on economic performance. Yet even he did not try to make the economy a central political issue.
I think this was the result of a deeply sociological problem. Politics had been confined to a very narrow habitus. Because of this, the ability to imagine alternative possibilities was lost. Babacan, for example, spent months on remarks about waltzing and proposals about the Kurdish question. Instead, he should have rebuilt himself in the field everyone knew he was best at: the economy.
I can understand why being a politician who speaks about the economy in Turkey comes with many risks. I also understand that, in Turkish political culture, “the economy” is often imagined as the endless recital of numbers at crowded rallies. Many politicians who see themselves as operating at a higher level of politics could not accept this kind of role.
We also saw this in the main opposition. Instead of producing a convincing economic discourse, it staged an American economist joining from abroad. In doing so, it practically admitted that it had nothing more to offer than a repetition of Kemal Derviş, the figure who helped shape Turkey’s post-2001 political-economic order.
In Turkey, inflation has long resembled a kind of urban speculation. As the numbers rise, the land of power and opposition, capital and households, salaried workers and tenants is redistributed parcel by parcel.
When I wrote about this years ago, I thought the rush into housing was temporary. I assumed that, at some point, it would have to follow a different path. I was wrong. The process went far beyond any rational trajectory. Almost all economic activity was turned into rent speculation. This made an enormous contribution to social anomie.
Yet another point should not be missed. Turkey was already highly accustomed to inflationary atmospheres. At some point, we entered stagflation. Whether we have managed to exit it, I do not know. We cannot properly measure inflation. We cannot properly measure prices. We cannot properly measure growth either.
We are like a doctor trying to treat a patient with broken equipment. The blood test results are wrong. The thermometers are expired. The imaging devices are unreliable. The test instruments are always incomplete.
I previously tried to bring these inflation figures together in two separate blog posts. Those posts are still relevant, and they contain important visualizations. In one, I compared TÜİK and ENAG. In the other, I tried to explain the background of Turkey’s political economy.
1. The Construction of the Numbers: Three Sources, Three Different Statuses
Just as housing production as a commodity brings the state, the bank, and the middle class to the same table, inflation traps data, politics, and economics within the same chart.
The TÜİK figure is still the official mortar of many contracts. It shapes everything from the rent increase ceiling to the minimum wage. Yet since 2022, item-level price lists have been shared with the public only in a very limited way. Even the “raw” versions of prices are not disclosed, despite long court processes. For this issue, one may look at Çiğdem Toker’s articles, starting here.
The ENAG figure is produced by independent academics. They do not explicitly say that they use daily web-scraping techniques. But since their data are daily, I assume that this is probably the case. Still, the code and documentation are not public. The website appears to have stopped updating in February 2025. The data are now shared mostly on X, formerly Twitter.
Their reporting method also includes warnings about a patent process. For academics, I find this somewhat exaggerated. On the other hand, they took on this work at a very difficult time and under serious risks. For that reason, they deserve considerable appreciation.
The İTO figure is the Istanbul consumer price index produced by one of Istanbul’s oldest institutions, Istanbul Chamber of Commerce. Yet in January 2025, İTO announced that it had “switched to the Eurostat method.” After this, the PDF bulletins disappeared. The base year was also reset to 2023.
From February onward, the figures can only be traced through news websites. The Istanbul Chamber of Commerce had published its index since 1995 under the name “Istanbul Wage Earners’ Cost of Living Index.” After thirty years, it suddenly changed this index.
In this table, the distinction between official, semi-official, and unofficial reminds me of the legal differences between TOKİ, Emlak Konut, and the gecekondu. Whose statement counts officially? Whose statement is accepted as “real” in the neighborhood? Even the land of numbers is tied to a problem that resembles property regimes and real estate speculation.
2. Who Measures What on the Ground?
İTO calls its basket “the most comprehensive.” It includes 368 items and reweights them according to a 2023-based Eurostat framework. But there is no PDF. There is no archive. Since at least January 2025, the information has appeared only as press releases.
My view is that İTO actually wanted to abolish this index. But it also did not want to erase a thirty-year institutional effort. Such institutional continuity is rare in Turkey. So instead of ending the index completely, İTO seems to have made it less visible under political and administrative pressure. After all, İTO was the institution whose data I had the hardest time accessing.
I also cannot make sense of ENAG’s methodological disclosure. There is no weight table, or at least I could not find one. They have justified concerns, of course. But the one-page explanation on their website does not seem sufficient to me.
For example, I am especially interested in their claim that they collect 250,000 rent observations every month. If this could be shared with the public, it would make a serious contribution to academic research.
TÜİK, by contrast, acts as if there is too much data. It declares item-level prices to be a “commercial secret.” In this way, the three institutions criticize each other while looking into the same mirror. Each has different problems. Yet information itself is the most valuable speculative plot of land.
On paper, TÜİK’s methodological note looks quite reasonable:
Computer-Assisted Personal Interviewing, or CAPI: surveyors visit businesses and record prices.
Barcode or sales data: sales data are collected directly from chain markets and local firms.
Web scraping: price data are automatically collected from websites.
Computer-Assisted Web Interviewing, or CAWI: company representatives complete online surveys.
Computer-Assisted Telephone Interviewing, or CATI: rent and some service prices are collected by phone.
Administrative records: data are collected directly from institutions such as EMRA and airline companies, for items such as fuel and airline tickets.
Apart from the expenditure-group weights below and the appended 407-item list, we do not know much about what is measured or how. Those who remember the old data will recall that one could see the price of every item in the basket one by one. After 2018, these prices became the subject of serious criticism. From 2020 onward, they rapidly disappeared. They became invisible.
|
Code |
Main expenditure group |
2015 |
2016 |
2017 |
2018 |
2019 |
2020 |
2021 |
2022 |
2023 |
2024 |
2025 |
|---|---|---|---|---|---|---|---|---|---|---|---|---|
|
01 |
Food and non-alcoholic beverages |
24,25 |
23,68 |
21,77 |
23,03 |
23,29 |
22,77 |
25,94 |
25,32 |
25,43 |
24,98 |
24,97 |
|
02 |
Alcoholic beverages and tobacco |
4,82 |
4,98 |
5,87 |
5,14 |
4,23 |
6,06 |
4,88 |
4,31 |
3,57 |
3,76 |
3,52 |
|
03 |
Clothing and footwear |
7,38 |
7,43 |
7,33 |
7,21 |
7,24 |
6,96 |
5,87 |
6,42 |
6,41 |
6,94 |
7,16 |
|
04 |
Housing |
15,79 |
15,93 |
14,85 |
14,85 |
15,16 |
14,34 |
15,36 |
14,12 |
16,62 |
14,20 |
15,22 |
|
05 |
Furnishings and household equipment |
7,78 |
8,02 |
7,72 |
7,66 |
8,33 |
7,77 |
8,64 |
8,86 |
8,67 |
8,12 |
7,67 |
|
06 |
Health |
2,57 |
2,66 |
2,63 |
2,64 |
2,58 |
2,80 |
3,25 |
3,24 |
3,53 |
3,71 |
4,09 |
|
07 |
Transportation |
15,38 |
14,31 |
16,31 |
17,47 |
16,78 |
15,62 |
15,49 |
16,80 |
15,08 |
17,35 |
15,34 |
|
08 |
Communication |
4,38 |
4,42 |
4,12 |
3,91 |
3,69 |
3,80 |
4,64 |
3,78 |
3,30 |
3,34 |
3,62 |
|
09 |
Recreation and culture |
3,54 |
3,81 |
3,62 |
3,39 |
3,29 |
3,26 |
3,01 |
3,06 |
3,25 |
3,33 |
3,36 |
|
10 |
Education |
2,53 |
2,56 |
2,69 |
2,67 |
2,40 |
2,58 |
2,28 |
2,03 |
1,67 |
1,80 |
2,31 |
|
11 |
Restaurants and hotels |
6,98 |
7,47 |
8,05 |
7,27 |
7,86 |
8,67 |
5,91 |
7,11 |
7,82 |
8,17 |
8,32 |
|
12 |
Miscellaneous goods and services |
4,60 |
4,73 |
5,04 |
4,76 |
5,15 |
5,37 |
4,73 |
4,96 |
4,64 |
4,30 |
4,43 |
The lines in the chart above should have met at some point. But they never did.
Inflation plays a major role in societies like Turkey. These are societies where small commodity producers become urban shopkeepers and petty proprietors. Inflation takes from fixed-income earners. It gives to those whose only social function is to act as intermediaries.
Turkey seriously underestimated the local power of what I call shopkeeperocracy. As a result, the country is once again experiencing a more troubling version of the deadlock it entered in 2018: rising inflation and a shrinking economy.
3. Coding the Visual: From HTML to a React Panel
The first two visualizations, which you can see here, were built with raw HTML and JavaScript. This was a relatively easy way to share them on the blog. But inflation is announced every month. For that reason, HTML is a very limited format for maintaining this visualization over the long term.
I also had another concern. As the visualization became more complicated, it would put more pressure on my server, which already runs with limited resources.
I cannot promise monthly updates. Still, a dashboard has emerged. It is a Turkey inflation panel that I will try to keep updated and improve whenever I have time.
The new React-based panel can be described as a kind of meta-interface. It is also a digital instrument of the economic signifier regime. It allows data from three different sources, TÜİK, ENAG, and İTO, to be presented on a comparative plane.
The panel will have three main functions.
First, it will visualize inflation curves produced through different measurement methods. I hope this will make visible the dialectic between official, unofficial, and semi-official declarations.
Second, it will offer a dynamic analysis of how basket weights have changed over time. These weights are not just technical details. They are the embodied form of classed, spatial, and temporal imaginaries. From 2015 to 2025, changes in basket weights reveal the social commitments of neoliberal economic policies. They also reveal the changing character of class alliances.
I have not yet implemented this part. I hope to enrich the panel with basket weights and seasonally adjusted data. I will do this in the coming months as I find time.
Third, the panel will show the mismatch between a political-economic theory of inflation and Turkey’s specific macroeconomic conditions. In a high-inflation environment, the artificial stabilization of basket weights is nothing other than a denial of reality.
This is exactly what I am trying to explain through the concept of shopkeeperocracy. We need to study much more carefully the social class fraction we call esnaf. This includes everyone from the small contractor to the largest state-TOKİ contractor, from the small shopkeeper to the car dealer, and from the market trader to the wholesale sellers.
4. Metadata and the Regime of Truth
To speak of data is not to accept that data simply exist. On the contrary, it means asking how data are produced, circulated, and made meaningful.
The intellectual milieu I come from spent many years trying to remain free of data. It moved away from the effort to understand how data are produced and transformed into knowledge. At the same time, it often treated statistics and data with contempt.
But when the data disappeared, this attitude revealed itself as deeply mistaken. It was also hostile to its own interests. Even with inflation, which an ordinary society should be able to measure quite easily, we now have three separate datasets. They are far apart from one another. Only their movements resemble each other.
If we do not think about data, how can we understand the most basic social and economic reality that we expect data to reveal?
TÜİK’s methodological opacity is no longer just a technical issue. The lack of transparency in data collection, cleaning, and calculation has become an epistemological crisis. As Çiğdem Toker’s struggle and the following legal processes have shown, inflation data are increasingly treated as a kind of “state secret.”
Yet TÜİK claims that its methods are compatible with universal standards. If that is so, those methods must be open to detailed scrutiny.
ENAG’s methodological closure is different. Paradoxically, it emerged as a response to the methodological opacity of official institutions. It points to the existential anxieties of an independent academic initiative.
The patent process seems to function less as an academic concern and more as a shield against political pressure. Still, more transparency about daily data collection techniques, especially web scraping, would only strengthen ENAG’s credibility.
İTO’s decision to say that it had “switched to the Eurostat method,” change the base year, and almost shelve a thirty-year institutional accumulation shows something important. Data-production mechanisms in Turkey are deeply dependent on the political conjuncture. This is also a strong sign that İTO’s historical institutional autonomy has been eroded.
5. The Inflation Panel: The Architecture of a Small Public Data Tool
The inflation panel is now available as an open-source project on GitHub: Turkey Inflation Dashboard — English version
The project is a React-based dashboard built with Vite and styled with Tailwind CSS. It compares inflation data from three sources: TÜİK, ENAG, and İTO. The aim is simple: to place official, semi-official, and independent inflation figures side by side, and to make the distance between them visible.
Technically, the dashboard is a static single-page application. It does not rely on a heavy backend or database. Instead, it loads pre-processed data from JSON files and, when configured, from a public Google Sheet. This makes the project easier to maintain and update as new monthly inflation figures appear.
The architecture has three basic layers.
The first layer is data preparation. TÜİK, ENAG, and İTO figures are gathered, cleaned, and converted into a comparable format.
The second layer is data delivery. The dashboard can use bundled JSON files, but it can also read from a Google Sheet. This makes monthly updates more practical.
The third layer is visualization. React components turn the data into charts, indicators, and comparisons. Users can examine different sources and time periods, and see how the inflation figures diverge.
This is why the panel is more than a technical object. It is also a small public data tool. It does not claim to solve the problem of inflation measurement in Turkey. But it does something important: it makes competing numbers visible within the same frame.
That distance between the numbers is not merely statistical. It is also political, institutional, and epistemological.
6. A Socio-Political Economic Critique of Inflation
Quantification is one of the most sophisticated mechanisms of domination in capitalist modernization. Digitalization constantly creates the impression that things are inaccessible. This mechanism can only be opposed by intervening in how it is produced. It must be understood and challenged from within.
From this perspective, inflation figures in Turkey should not be treated as a mere technical matter. They should be treated as the object of a deep political-economic analysis.
The economic crisis that became clear in Turkey after 2018 was, in fact, a symptom of the exhaustion of the post-2013 neoliberal growth model. High inflation became the most visible sign of this crisis. It produced three major effects.
First, inflation became a structural mechanism of income transfer against fixed-income groups. This includes public employees, pensioners, and minimum-wage workers. It accelerated the shift from a relatively homogeneous middle-class structure to a polarized income distribution.
The widening gap between TÜİK, ENAG, and İTO figures serves to hide the scale and speed of this income transfer.
Second, inflation creates a dynamic of spatial reproduction. Housing and rent inflation often run above general inflation. This deepens class segregation in urban space. It also sharpens socio-economic differences between neighborhoods and districts.
In this sense, the process continues the neoliberal urbanization policies that have been in place since the 1980s. But today, it is happening much faster and in a much more traumatic form.
Third, inflation is both a sign and a trigger of a crisis of political legitimacy. The erosion of trust in TÜİK data is both a result and a cause of declining trust in state institutions. This weakens social consensus and deepens political polarization.
7. Instead of a Conclusion: Counter-Data Against Data
I hope that the code I have written and the visualizations I have produced from mined data will make a modest contribution to debates on inflation in Turkey. At the same time, I know that this effort is also a form of “counter-data” production.
Dominant data regimes produce their own narratives of truth. Questioning these regimes is an indispensable part of critical social-scientific practice.
Despite its technical limitations, the inflation panel places figures produced by different methodologies side by side. It gives readers and users the chance to make their own assessment. This approach serves the ideal of making economic data more democratic and transparent.
In the end, the inflation debate in Turkey is not simply about whether the numbers are right or wrong. It is about something deeper. It is a political struggle over the production and circulation of economic discourse and knowledge.
In this struggle, critical academia has several tasks. It must demand transparency in data. It must develop alternative methodologies. Most importantly, it must make visible the social reality behind the numbers.
Inflation is unnatural. In the form experienced by Turkey, it is a massive injustice. It is directly opposed to basic human rights.
For this reason, we need counter-data against data. This need continues, just as Turkey’s search for macroeconomic stability continues. And just like the country’s economic situation, the question of when and how this construction will be completed depends on more than technical factors. It also depends on political, social, and institutional dynamics.